- Use cases
- Japan Farm Use Case
Use case Benefits


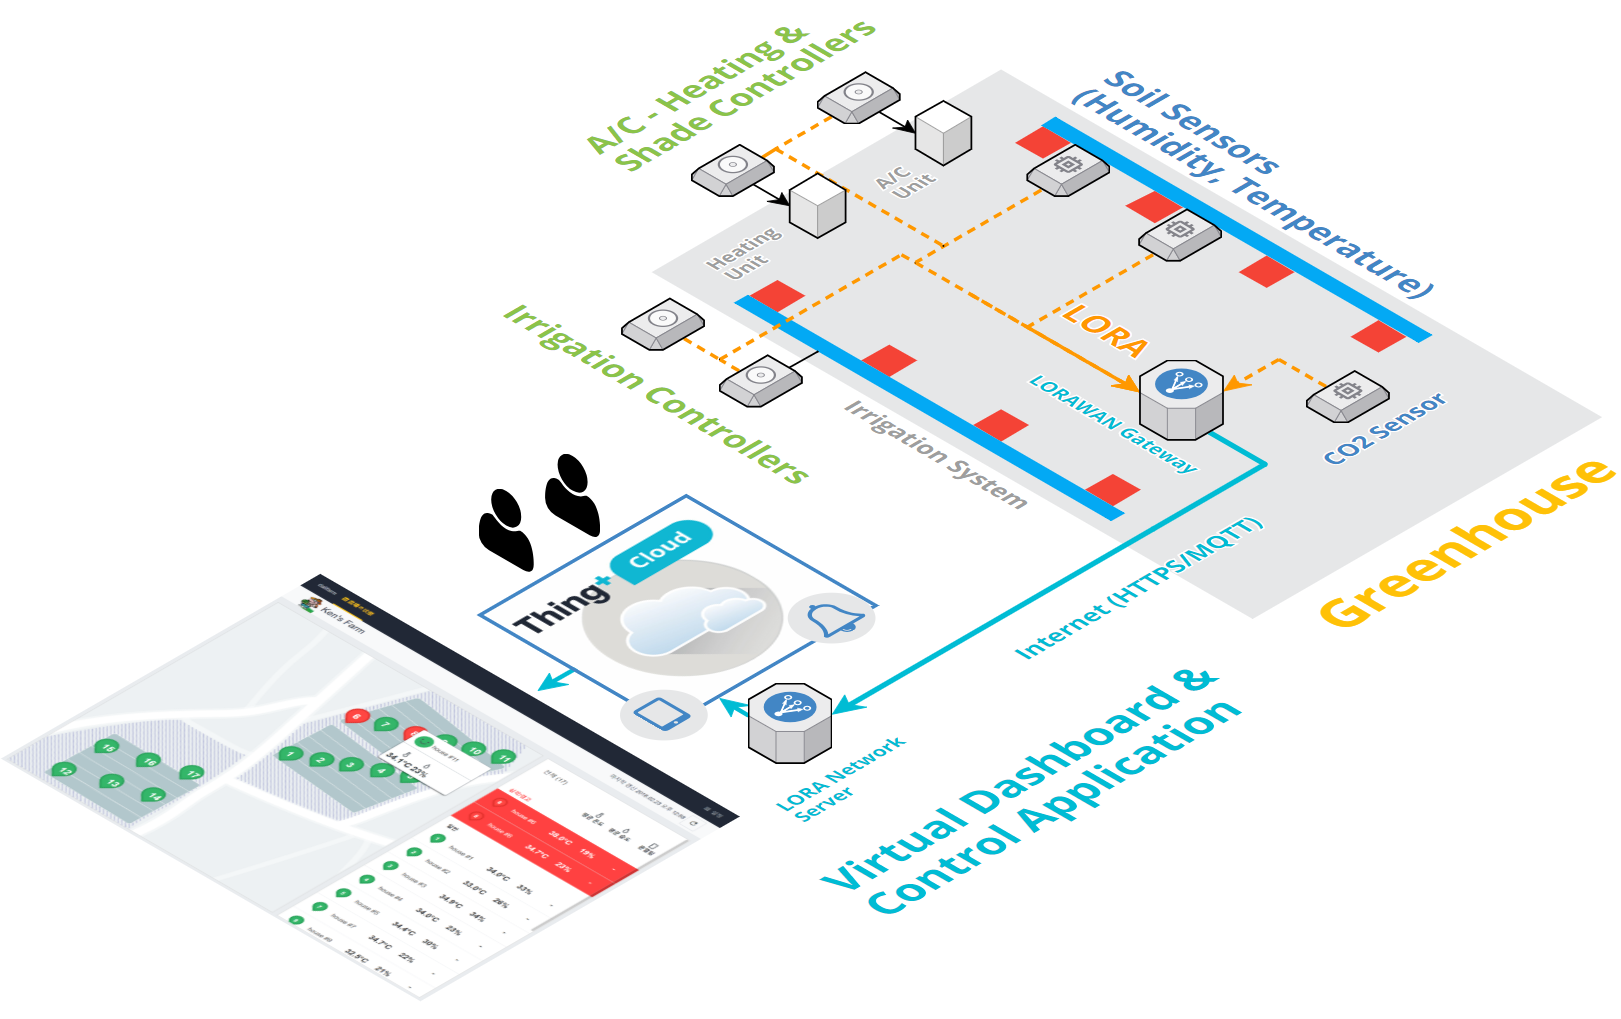
System architecture
The below image shows the hardware and software used to create the full end-to-end solution
The Thing+ cloud and web application was used as the core of the operator-facing experience,
with hardware from partner RisingHF handling the collection of data on premise
Hardware Details

Gateway
Rising HF
LoRa Gateway_industry

Sensor
Rising HF
LoRa Temperature / Humidity

*Optional
Sensor
Tracknet
Tab Door & Window
SYSTEM APPLICATION AND
OPERATION EXAMPLES

SYSTEM APPLICATION AND
OPERATION EXAMPLES
Real-time status screen
Full-picture Greenhouse Status Dashboard
In this specific case, 17 greenhouses were placed on a map view with the data collected in real-time viewable either through clicking on specific greenhouses, or through the list view on the right. This view is primarily used for greenhouse operators to quickly respond to any issues detected, in a traditional “command and control center” way
SYSTEM APPLICATION AND
OPERATION EXAMPLES
SYSTEM APPLICATION AND
OPERATION EXAMPLES
Detailed Data Screen
Per-Greenhouse Detail View
Upon the operator drilling down to view a single greenhouse, all sensors placed physically inside are seen in the actual position through a “virtual twin” of the greenhouse. Specific devices can be drilled down into, where historical alarms, graph data, and current status can all be immediately viewed
This data is also used for setting up automated alarms and status updates through the Thing+ “rules engine” where SMS messages are sent for critical problems, such as extremely high/low temperatures, or doors that have been left open
